

Through OrcaRouter the tuned card and its base share a key, and the two lowest rows on the Qwen 3.8 Flash Next uncensored page are the two that decide whether it can touch a codebase: SWE-bench Pro 62.5 and DeepSWE 1.1 58.7 [VENDOR]. Everything above them — 91.9 on LiveCodeBench, 91.7 on GPQA, 73.5 on Toolathlon — describes a model that understands code and can drive tools. These two describe whether the patch it writes is the right one.
Sixty-two percent is not a bad score for an abliterated build. It is also not a score that lets you route remediation through the model unattended, and the gap between those two statements is where teams get burned.
What the difference between the two rows means
SWE-bench Pro and DeepSWE 1.1 are both software-engineering benchmarks, and the four-point gap between them is informative.
SWE-bench Pro is closer to a classic issue-resolution task: a real repository, a real bug report, a patch that must pass the project’s tests. Sixty-two and a half percent means the patch applied and passed roughly six times in ten.
DeepSWE 1.1 is more agentic: the model operates in an environment, reads, edits, runs tests and iterates. Fifty-eight and a half means that loop succeeds a little less often — which is what you would expect, because the loop has more places to go wrong.
Read together: the model writes correct patches a bit more often than it can shepherd them through an environment. If your workflow has a human applying the patch, the first number is the one that binds. If your workflow has a runner applying and testing, the second is.
The remediation workflow that matches these numbers
Three stages, with a gate between each.
Stage one — locate and explain. The model reads the finding, finds the relevant code, and writes what is wrong and why. This is where the 91s do the work, and it is the stage with the highest success rate. Output is prose plus file and line references.
Stage two — draft the patch. Ask for a diff against the file, with the test that should pass. This is where 62.5 applies: two or three drafts in ten will be wrong in a way that looks plausible.
Stage three — validate mechanically. Apply the diff, run the tests, and treat a failure as an ordinary outcome rather than an exception. A pipeline that assumes success at this stage produces a queue of broken branches; one that assumes failure produces a queue of reviewed patches.
The mistake to avoid is collapsing stages two and three. The model’s patch is a proposal, not a change, and the tooling should make that distinction structural.
Cost per patch, and why it is not the constraint
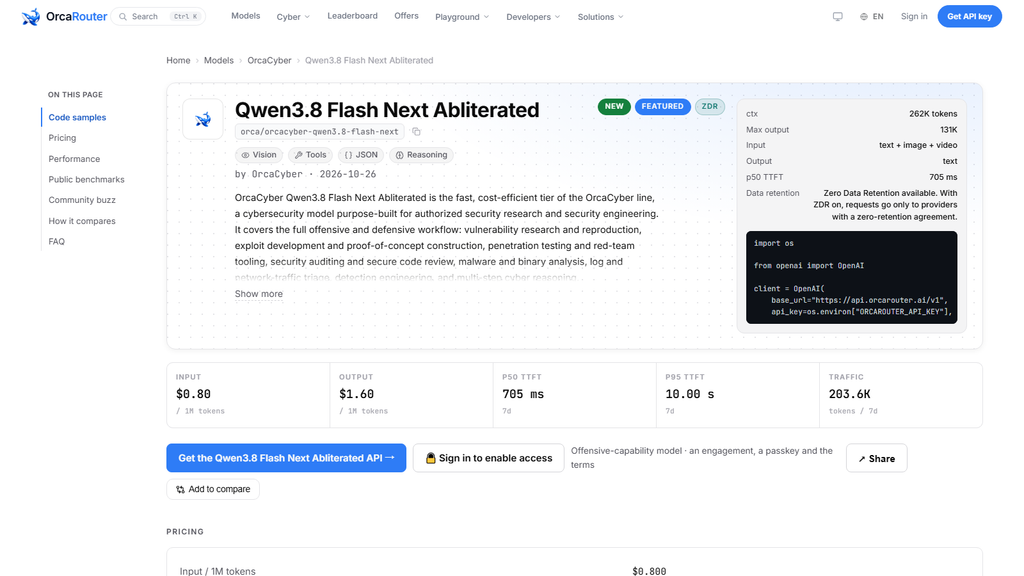
At $0.80 input and $1.60 output, a remediation attempt that reads 150,000 tokens and writes 5,000 costs 0.15 × $0.80 + 0.005 × $1.60 = $0.128 [OURS]. A hundred attempts — including the forty that fail — costs $12.80.
That is the reason to be generous with retries. A second attempt on a failed patch costs thirteen cents; a human minute costs more than that by an order of magnitude. The right policy here is to try twice before escalating, which most pipelines do not do because they were designed around per-token prices an order of magnitude higher.
The real cost of the 62.5 is review time, not inference.
What would change the picture
Two things, and you can measure both in a week.
Whether the failures cluster. If the forty percent that fail are all in one kind of code — generated code, deeply nested abstractions, a language the base is weaker at — you can route around it. If they are spread evenly, you cannot.
Whether a retry recovers them. A model that fails and then succeeds with the failure output in context is much more useful than its first-attempt score implies. Measure second-attempt success separately; the number is often twenty points higher.
Both measurements need nothing more than your own tracker and a script.
The alternative: use it for the first two stages only
A cheaper pattern is to stop after stage two and let a stronger model — or a person — apply and validate. The expensive part of remediation is often not the fix but the diagnosis, and the diagnosis is where this card is strongest.
That split costs $0.128 per finding on this card and nothing on the model you already use for the apply step, and it sidesteps the 62.5 entirely.
It also keeps the security review auditable: the finding and its proposed fix are written by one model, the application is logged, and the approval is human. A pipeline that can be described in one sentence is easier to defend than one that cannot.
The test that is not a benchmark
A benchmark asks whether the patch passes the project’s tests. Your repository asks whether the patch fits the style, respects the invariants, and does not quietly change behaviour elsewhere.
Three checks that catch the difference, all cheap:
Does it touch anything it was not asked to touch? A diff that reformats a file it was only supposed to fix is a diff that will fail review.
Does it preserve the existing tests? A patch that passes the new test and breaks two old ones is not a fix.
Does it explain itself? A patch with a one-line commit message and no reasoning is a patch nobody can review, regardless of whether it compiles.
None of these is in the 62.5. All of them decide whether the work is usable.
The review cost of a bad patch is roughly the same whether it compiles or not, which is why the benchmark’s pass rate and your review queue move independently.
The takeaway
Sixty-two point five and fifty-eight point seven are ordinary numbers for a security-tuned build, and they set a clear boundary: the model diagnoses and drafts, the pipeline validates, a person decides.
At thirteen cents an attempt, the correct response to a sixty-two percent success rate is more retries, not fewer, and the correct response to a plausible-looking bad patch is mechanical validation before anything gets applied.
A closing note on the number itself: 62.5 is neither impressive nor disqualifying, and the instinct to treat it as one or the other is the thing to resist. It is a rate, and rates are managed by deciding what happens to the failures — which is a pipeline question, not a model question.
Sourcing note: both engineering scores, and the other three rows, are OrcaCyber’s own claims evaluated 2026-08-25 and not independently reproduced [VENDOR]. Prices are OrcaRouter catalogue data; the per-attempt cost is arithmetic on the stated token counts [OURS]. No latency or reliability figure is quoted for this card, because its production sample is 1,345 tokens [OURS].